
 Johns Hopkins Center for Communication Programs
https://breakthroughactionandresearch.org/wp-content/uploads/2024/04/KAP-COVID-Laptop-1280-720.jpg
720
1280
Marcela
https://breakthroughactionandresearch.org/wp-content/uploads/2017/12/breakthroughactionandresearchlogo-300x110.png
Marcela2021-02-10 19:47:552024-04-19 09:56:47Using the KAP COVID Dashboards to Convince the Vaccine Hesitant
Johns Hopkins Center for Communication Programs
https://breakthroughactionandresearch.org/wp-content/uploads/2024/04/KAP-COVID-Laptop-1280-720.jpg
720
1280
Marcela
https://breakthroughactionandresearch.org/wp-content/uploads/2017/12/breakthroughactionandresearchlogo-300x110.png
Marcela2021-02-10 19:47:552024-04-19 09:56:47Using the KAP COVID Dashboards to Convince the Vaccine Hesitant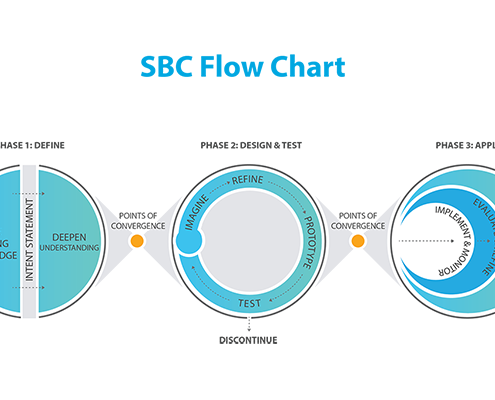 Breakthrough ACTION
https://breakthroughactionandresearch.org/wp-content/uploads/2021/01/SBC-Flow-Chart-EN-600-400.png
400
600
Marcela
https://breakthroughactionandresearch.org/wp-content/uploads/2017/12/breakthroughactionandresearchlogo-300x110.png
Marcela2021-01-12 22:24:032024-04-16 10:11:56Social and Behavior Change Flow Chart
Breakthrough ACTION
https://breakthroughactionandresearch.org/wp-content/uploads/2021/01/SBC-Flow-Chart-EN-600-400.png
400
600
Marcela
https://breakthroughactionandresearch.org/wp-content/uploads/2017/12/breakthroughactionandresearchlogo-300x110.png
Marcela2021-01-12 22:24:032024-04-16 10:11:56Social and Behavior Change Flow Chart https://breakthroughactionandresearch.org/wp-content/uploads/2019/10/blog-BR-trending-topic-zika.jpg
3024
4032
Marcela
https://breakthroughactionandresearch.org/wp-content/uploads/2017/12/breakthroughactionandresearchlogo-300x110.png
Marcela2019-10-28 10:09:012024-03-01 12:03:11Breakthrough ACTION + RESEARCH Resources from the USAID Zika Response
https://breakthroughactionandresearch.org/wp-content/uploads/2019/10/blog-BR-trending-topic-zika.jpg
3024
4032
Marcela
https://breakthroughactionandresearch.org/wp-content/uploads/2017/12/breakthroughactionandresearchlogo-300x110.png
Marcela2019-10-28 10:09:012024-03-01 12:03:11Breakthrough ACTION + RESEARCH Resources from the USAID Zika Response