Using the KAP COVID Dashboards to Convince the Vaccine Hesitant
 Johns Hopkins Center for Communication Programs
Written by Marla Shaivitz, Director of Digital Strategy, Johns Hopkins Center for Communication Programs
Now that safe and effective vaccines are available for COVID-19, worldwide distribution and acceptability are critical to ending the pandemic. At least 75% of the population needs to be vaccinated to attain the herd immunity necessary for curbing disease spread. However, data shows an inadequate number of people are willing to be vaccinated in order to achieve this. A new analysis of COVID-19 knowledge, attitudes, and practices (KAP) shows that through January 2021, global vaccine acceptance rates are beginning to increase (66%) after months of hovering around 62–64%.
The latest in a series called KAP COVID dashboards, this new dashboard focuses solely on global vaccine acceptance, with the goal of assisting public health practitioners at all levels—country, local, and community—in their work to increase vaccination acceptance levels and reduce vaccination hesitancy. By looking at “who”—that is, those messengers who influence decision-making and those in most open to receiving messages—this visualization is the starting point for figuring out which messages will be most effective and who should receive them.
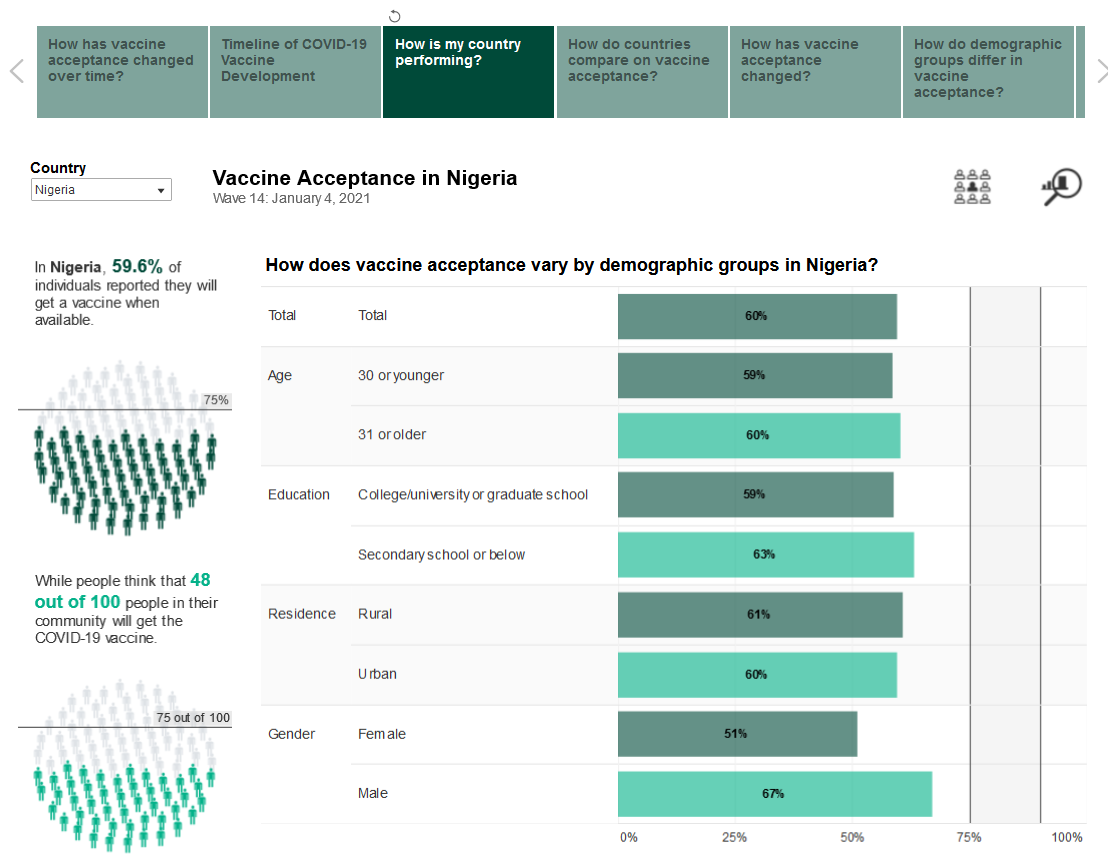
While practitioners should interpret the data within their own country context, general takeaways from the latest wave of data (January 4, 2021) include the following:
- Through December 2020, global vaccine acceptance rates have remained constant between 62% and 64%. A slight increase in vaccine acceptance to 66% was present in Wave 14, the most recent wave. This is despite the fact that the launch of vaccines in some high-income countries is pending.
- Men and women marginally differed, when asked if they would take the vaccine when available, in reporting, “Definitely yes” or “Probably yes.” Country data reflected little more than a five percentage point difference between genders. Exceptions included the Philippines (women 48%, men 57%), Japan (women 50%, men 62%), Egypt (women 58%, men 67%), Turkey (women 26%, men 36%), France (women 53%, men 63%) and Colombia (women 61%, men 68%).
- Comparisons of vaccine acceptance among urban and rural participants revealed trends across regions as designated by the World Health Organization (WHO). In the Americas and Europe, acceptance was higher among urban participants, while data showed the opposite in Africa, the Eastern Mediterranean, and the Western Pacific regions. Within most countries, acceptance among urban and rural participants varied only to a small degree. South-East Asia was mixed.
- The relationship between education level and vaccine acceptance was inconsistent across countries and geographic regions. Data from multiple low- and middle-income countries suggested that more educated individuals had slightly lower rates of vaccine acceptance than less educated individuals. Across many of the high-income countries, this was not the case. Country by country, public health officials will need to investigate whether educational differences are meaningful within particular areas or sub-groups. Tailoring messages based on education level can help shape the content and platform by which they are delivered.
- Matching demographic groups with the most salient and trusted sources of information is key to successful public health messaging, particularly among those who reported being “unsure” of their decision to get a vaccine. Across many countries, if these individuals choose to be vaccinated, the overall percentage of vaccinated people would be within the herd immunity target range.
- Researchers asked participants which sources of information about the COVID-19 vaccine would positively influence their decisions to get the vaccine. The dashboards display responses from those individuals most likely to change their decisions, i.e., having responded they would “probably,” “probably not,” or “are unsure” about getting a vaccination. Although globally, those surveyed consistently identify health workers as an influential source of information about COVID-19 vaccination, in many individuals in low- to middle-income countries, name WHO as the most influential. Respondents who were “unsure” or “probably” going to get vaccinated identify family and friends as influential.
- Individuals who reported they would “probably not” get vaccinated identified far fewer influential channels than those in the other categories. This suggests that either the categories presented were not relevant to them or that they are more set in their beliefs about not being vaccinated than those in the “unsure” or “probably” categories.
More than 1.5 million people have participated in the surveys since July 2020, and the data has been used by practitioners to support efforts in dozens of countries around the world including India, Indonesia, Jordan, Jamaica, Trinidad and Tobago, and Nigeria, to name a few. This study of KAP around COVID-19 is a collaboration among Johns Hopkins Center for Communication Programs, Facebook Data for Good, and the Massachusetts Institute of Technology. The WHO and the Global Outbreak Alert and Response Network served as advisors.
 Sara Holbak/VectorWorks/Photoshare
 K4Health
 WHO
WHO Breakthrough ACTION