KAP COVID Dashboard: Country profiles with demographic disaggregationsJohns Hopkins Center for Communication Programs

Using the KAP COVID Dashboards to Convince the Vaccine Hesitant

,
Written by Marla Shaivitz, Director of Digital Strategy, Johns Hopkins Center for Communication Programs Now that safe and effective vaccines are available for COVID-19, worldwide distribution and acceptability are critical to ending the…
A woman outdoors near tubs of liquid in Jamaica

SBC Flow Chart: Jamaica Mosquito Control Spotlight

, ,
This Spotlight provides an overview of how the SBC Flow Chart was applied to develop mosquito control solutions in Jamaica, including a spatial repellent.
Phase 1 Define: Mine existing knowledge, Intent statement, Deepen understanding; Phase 2 Design & Test: Imagine, Refine, Prototype, Test; Phase 3 Apply: Implement & Monitor, Evaluate & Refine, Adapt & ScaleBreakthrough ACTION

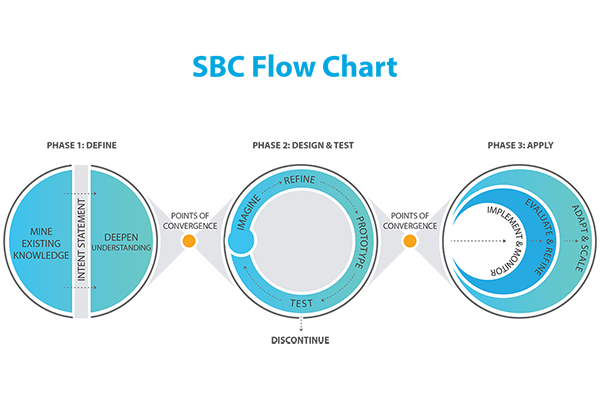
Social and Behavior Change Flow Chart

, , , , , , ,
Using human-centered design principles, the SBC Flow Chart asks users to adopt a beginner's mind to identify new insights to solve public health problems.

Breakthrough ACTION + RESEARCH Resources from the USAID Zika Response

, ,
This blog post introduces a suite of tools to help social and behavior change practitioners identify priority behaviors when responding to epidemics like Zika.